On Friday, December 4th, at the Agence française de développement (AFD) headquarters in Paris, Data-Pop Alliance (DPA), AFD, and the UK’s Department for International Development (DfID) co-hosted a COP21 side event on “Climate Change Resilience in the Age of Data”. Over the course of the day, 100 researchers and practitioners shared perspectives and worked together to explore the opportunities, challenges, and requirements for leveraging new data sources and analytical approaches to contribute to the COP21 goals by building greater societal resilience, chief of which through greater empowerment of at-risk communities.
While the main outcome of the COP21 conference itself, attended by close to 150 government representatives and 40,000 participants, was the “Adoption of the Paris Agreement” (which can be found here) that includes a commitment to “hold the increase in the global average temperature to below 2°C above pre-industrial levels”, our side event yielded the following 10 main take-aways:
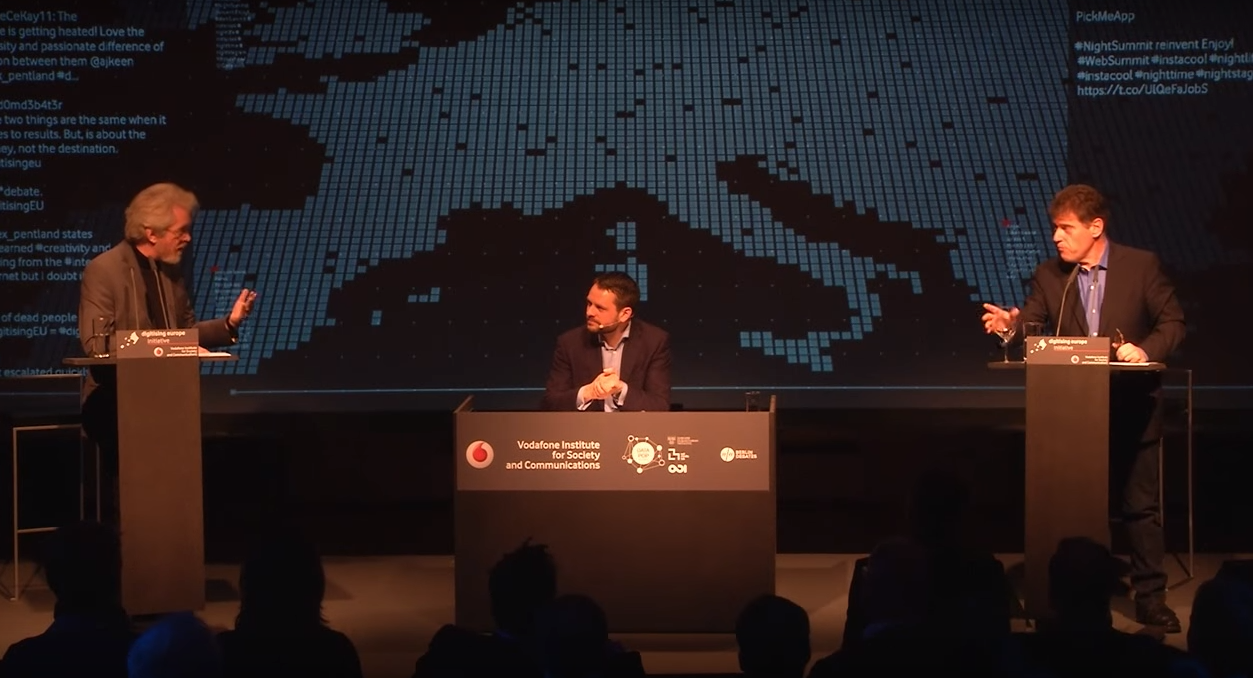
![panel1]()
Expert panelists discuss “The science of data analytics for climate resilience” during the #COP21Data event. From L to R: Marc Levy (Deputy Director of the Earth Institute’s CIESIN at Columbia University) Samuel Rufat (Associate Professor at the Université Cergy-Pontoise), Rebecca Moore (Director of Google Earth Engine and Outreach), Alain Retière (Co-Founder and CEO of EverImpact), and Erik Wetter (Co-Founder and Chairman of Flowminder.org).
10. We don’t fully understand the impact.
As noted in a report published by UNISDR last month, the frequency of climate related disasters stemming form floods, droughts, cyclones, etc., has roughly doubled over the past 2 decades; they currently account for 90% of all disasters worldwide. However, while we can better quantify some of these effects, we do not really understand their full impact, especially long-term, and their exact links to climate change. “The dose-response relationship – we currently don’t have that,” said Marc Levy, Deputy Director of CEISIN at Columbia University’s Earth Institute. More so, the evidence varies with the type of disaster – it is relatively easy to measure the impact of floods in terms of geographical spread, human casualty or population displacement, but that of droughts is harder to grasp. Often times when people measure change “they leave out drought because they cannot measure it… there are different levels of exposure to climate extremes,” Levy explained. This has serious implications, including political. In a New Yorker article last week, Elizabeth Kolbert highlights the impact of the droughts in Syria:
“On the list of horrors that led to Syria’s civil war, it’s hard to know how high to place the drought or its devastating consequences – the spike in food prices, the internal displacement, the further crowding of already overcrowded cities. Certainly, it ranks below the repressive brutality of Bashar al-Assad’s regime. Still, as Secretary of State John Kerry put it recently, in a speech about climate change and national security, it’s probably “not a coincidence” that the war was preceded by four years of failed rains.”
The words of French President Francois Hollande’s at the beginning of COP21 were, “Ce qui est en cause, c’est la paix” (“What is at stake is peace”).
Climate change impact does present itself in multifaceted and sometimes unanticipated ways, but we “risk falling into a siloization of climate concerns” such as focusing on floods and/or earthquakes”, says Kenneth Chomitz, a Fellow at Forest Trends. Here, the measured impact could be (integrated) data from destroyed crop yields, and/or a farmer’s income, yet “from a farmer’s perspective, there are lots of shocks coming in.”
9. Coordination and partnerships are crucial.
When posed the question, “What are the biggest economic and political barriers to realizing data use for climate action?” the response was overwhelmingly centered on lack of coordination and of (both strength and number of) partnerships. Mariéme Jamme, Co-Founder of Africa Gathering who sits on Data-Pop Alliance’s Board of Advisers elaborated: “One of the barriers is coordination. When people come to Senegal to talk about data, they talk to the governments and not [at the] grassroots level… The collaboration I am talking about is very specific. If we can open up a little bit and be more comfortable, at least give them a chance, we can show our skills.” Better coordination and dialogue could go a long way towards narrowing the decision-gap and the disconnect between policy-makers, project implementers, and affected communities. One channel would involve streamlining data collection and management for climate change resilience. Alongside multi-sector coordination – across governmental bodies, civil society, and the private sector – there is a strong need for partnerships among stakeholders of the same sector, especially those with parallel agendas. Craig Hanson, Director of the People and Ecosystems Program at World Resources Institute, lists “Partner” as one of the top six actions people can take in data use for climate action, and in the event’s closing session, Levy stated, “There is an underinvestment in grassroots partnerships.” Without a doubt, this is one place for growth.
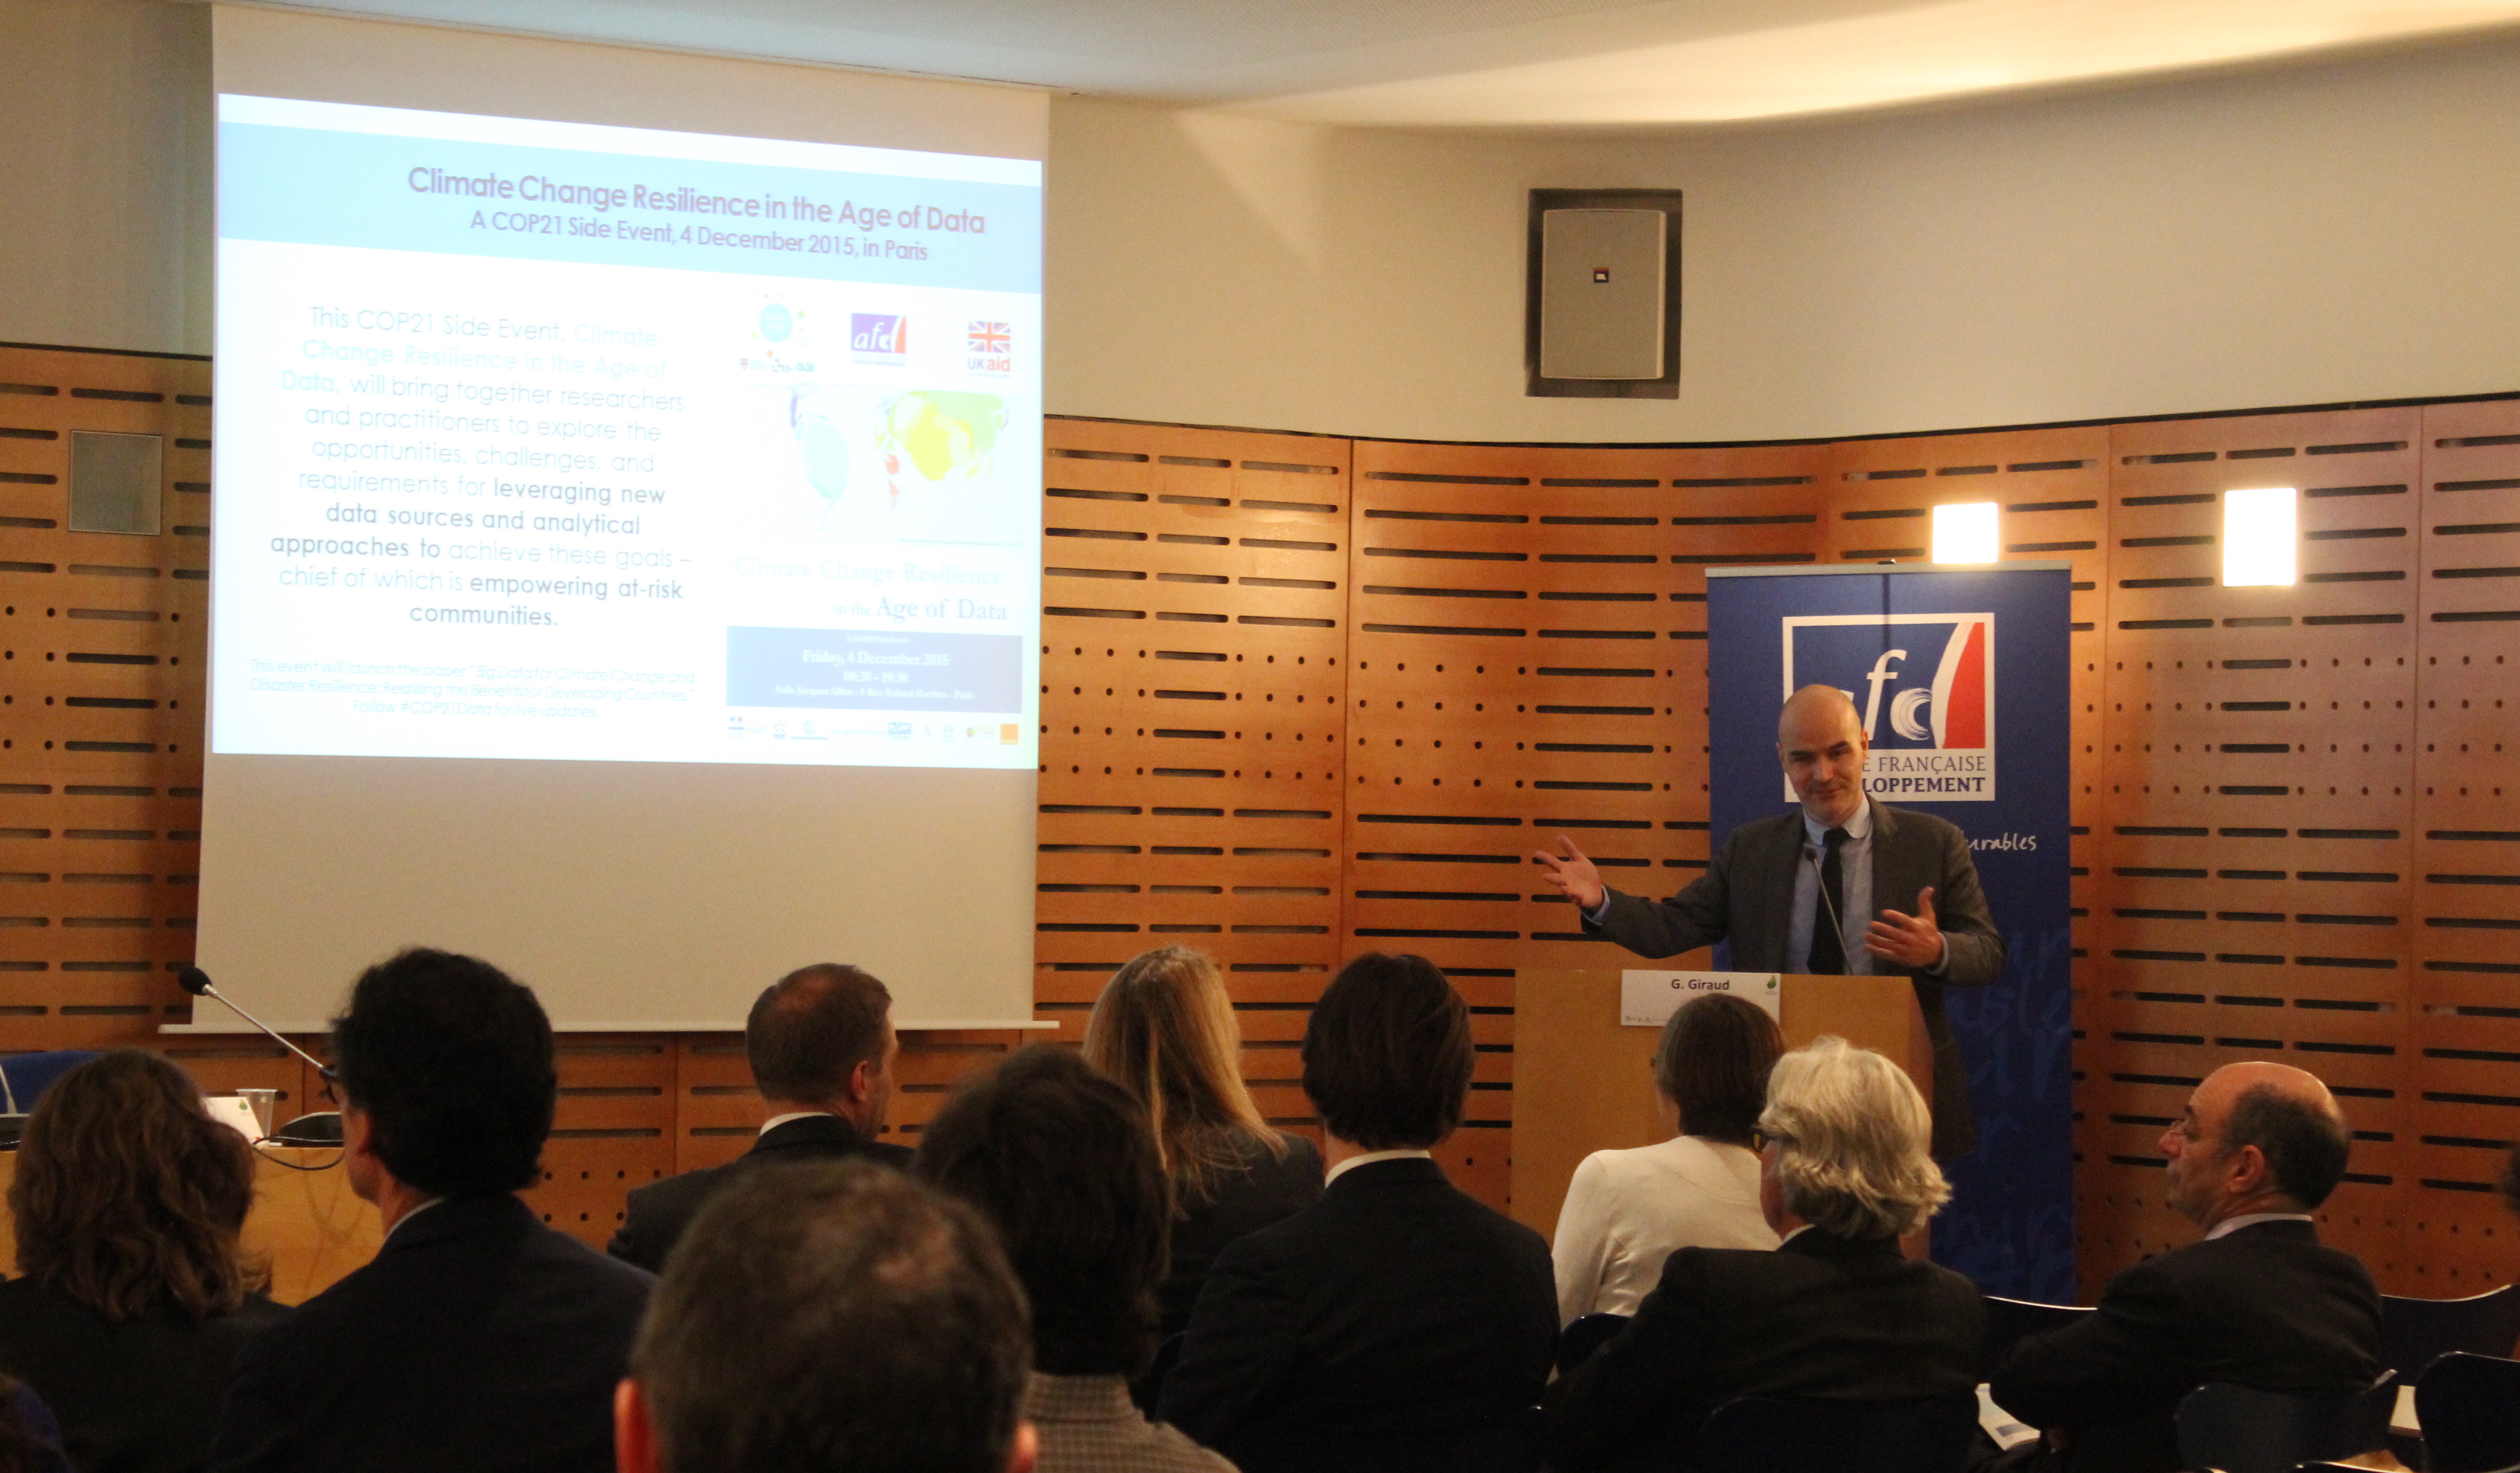
![IMG_3728]()
Data-Pop Alliance Director and Co-Founder Emmanuel Letouzé discusses the use of Big Data and the 3C’s at our COP21 side event, “Climate Change Resilience in the Age of Data” on December 4, 2015 in Paris.
8. We need an ecosystem’s approach to Big Data conceptualized through its 3 C’s.
Big Data was first conceptualized in the late 2000’s as exhibiting three main characteristics – volume, velocity, and variety (and sometimes a fourth – veracity). Today, we must expanding the conceptualization of Big Data, moving from one of content to one of context, and consider Big Data as an ecosystem made up of three Cs:
• Digital bread crumbs: pieces of data that are the digital translation of human actions and interactions captured by digital devices, the majority of which are passively emitted by users of digital devices and services.
• Big Data capacities or analytics: the set of tools and methods, hardware and software, and know-how and skills necessary to process and analyze these new kinds of data. The tools and methods include visualization techniques, statistical machine learning, algorithms, and more.
• Big Data communities: the actors involved in the Big Data ecosystem, from the generators of data to their analysts and end users – potentially the whole population.
As mentioned by Emmanuel Letouzé, Director and Co-Founder of Data-Pop Alliance, in his opening remarks, “it is only by conceptualizing Big Data as a vibrant ecosystem with actors rather than as an inert raw material to be exploited that we can shape its future for the better. Building greater resilience in complex human ecosystems through Big Data requires considering Big Data as an ecosystem of its own and figuring out how both can support and learn from each other”.
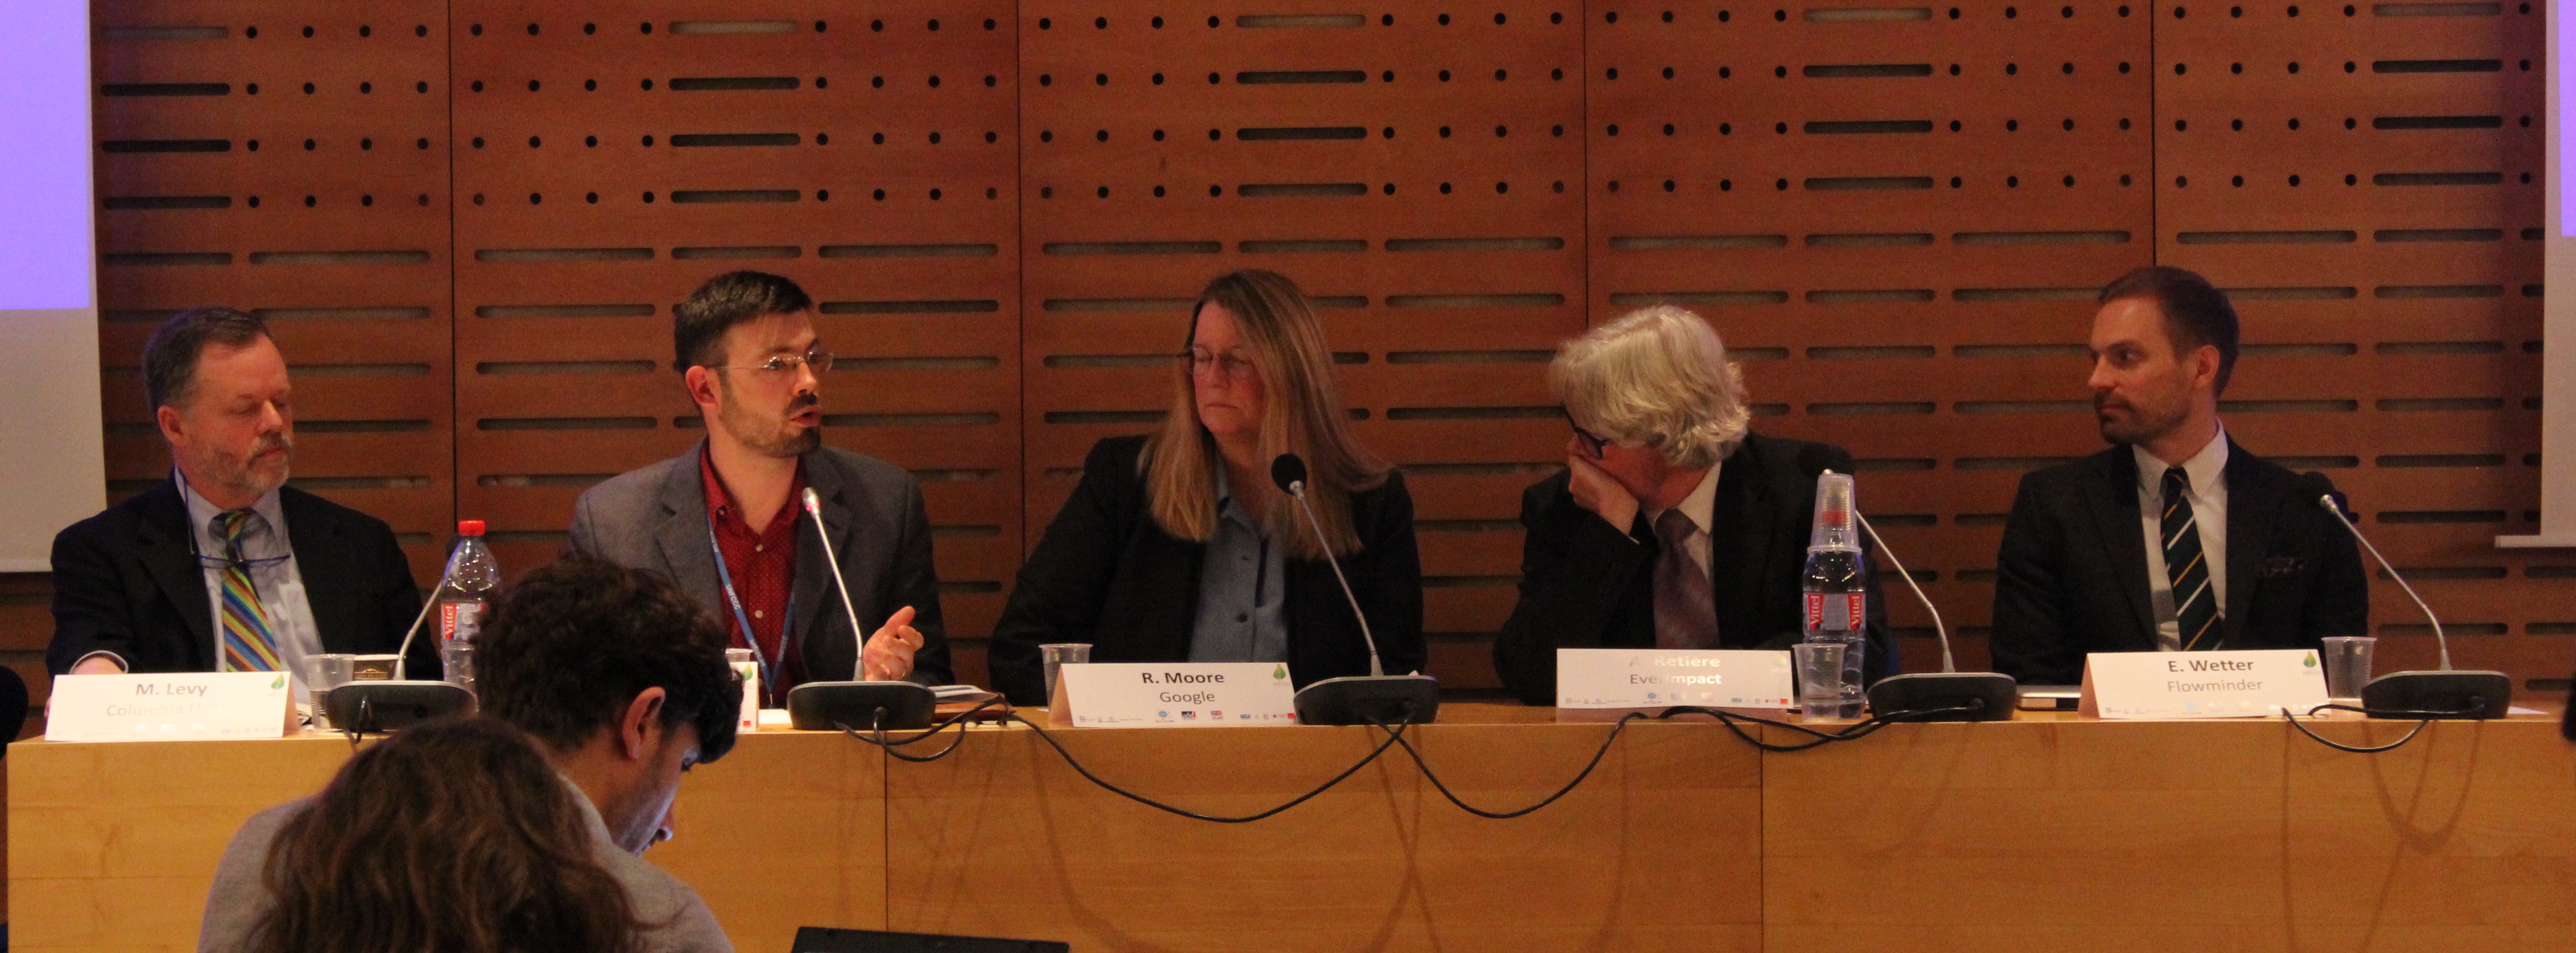
![panel2]()
A lively discussion on “Communities and citizens as sensors and responders in humanitarian contexts”. From L to R: Mariéme Jamme (Co-Founder of Africa Gathering and Data-Pop Alliance Advisory Board Member), Julie Cissé (Coordinator of GIPS/WAR), Simone Sala (Associate Director of the Dr. Steve Chan Center for Sensemaking and Data-Pop Alliance Research Affiliate), Patrick Vinck (Assistant Professor for Harvard University and Co-Founder and Co-Director of Data-Pop Alliance), John Crowley (Program Manager of Data for Climate Action at UN Global Pulse), and Silke Roth (Associate Professor of Sociology at the University of Southampton).
7. Involve and invest in local communities and data ecosystems.
Throughout the event, panelists and participants alike stressed the importance of incorporating both top-down and bottom-up processes, with several calls to direct greater attention and investment to the local level. Rebecca Moore, Director of Google Earth Engine and Earth Outreach, spoke to the importance of “data on the ground,” in addition to the sky (i.e. satellite data). “Ground-based evidence can be strongest, it can predict malaria outbreaks… weeks in advance.” She has found that the “pull model from the ground works better than the push from us.”
Nicolas de Cordes, Vice President of Marketing Anticipation for Orange, echoed this sentiment: “Fantastic use cases, so what? What’s the next step after models and pilots?” We need to reduce the cost of creating and making these algorithms (e.g. pilots) in order to grow local ecosystems. “A country that doesn’t grow a healthy data ecosystem will not be able to achieve the SDGs.”
This last one sums it up: “There is a lot of movement to get it working in the political space. Funds flow down to enable local action. They water the plant. When they stop watering, it turns brown, and then they kill it because it’s dead and then they don’t know why it died.” John Crowley, Program Manager of Data for Climate Action at the UN Global Pulse continues, “Top-down… there are long delays.”
6. Real-time data do not imply real-time insights.
In fact, it can “possibly only imply real time mistakes,” reckoned Erik Wetter, Co-Founder and Chairman of Flowminder Foundation. Even with mobile data sets, which were ranked first among data sources cited in the World Bank’s recent “Survey on the use of big data for the SDGs”, the information is only about anonymous subscribers. With the growing salience of real-time analytics and nowcasting, we still need to be able to integrate multiple data sets in order to derive actionable insights. Real-time data is just that – real-time data; sometimes it is not enough.
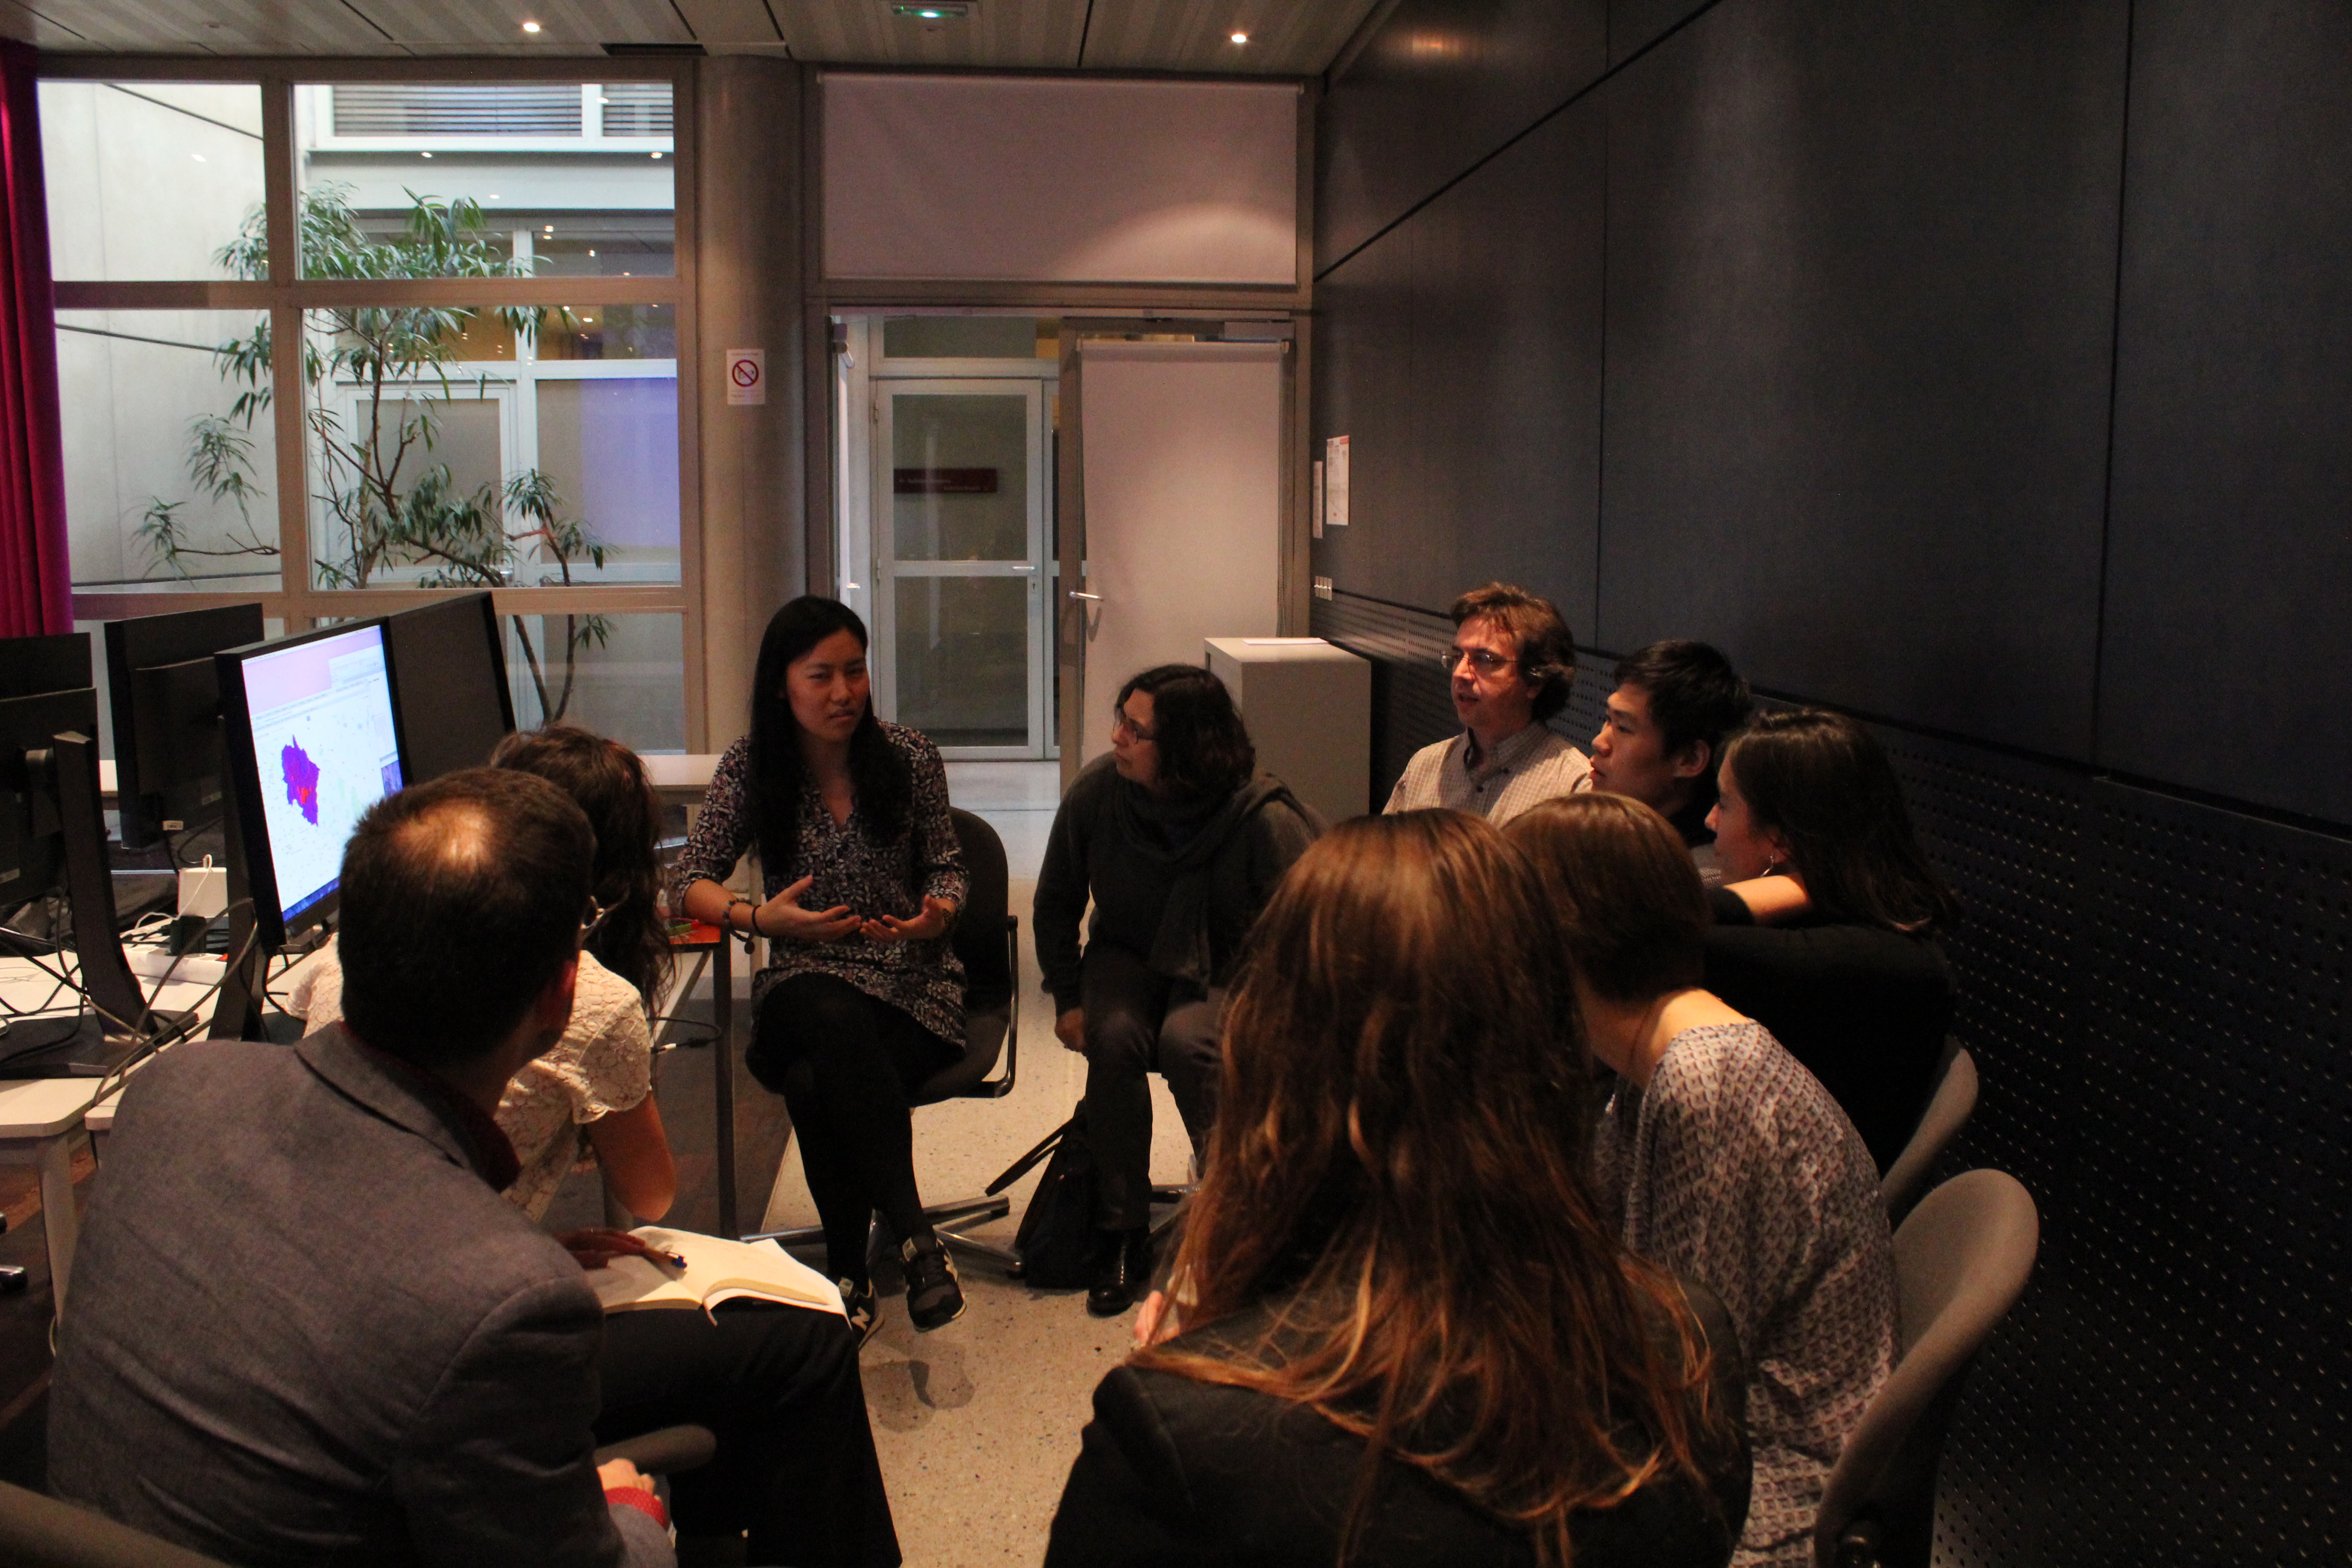
![IMG_3798 copy]()
One of the groups during our afternoon breakout technical sessions seeking to answer the question, “What does an actionable climate data tool and visualization look like and add?” using Google Earth Engine.
5. Institutions, legislations, and politics matter a great deal.
Data and technology won’t solve the climate crisis by themselves. Amy Luers, Assistant Director of Climate Resilience and Information in The White House Office of Science and Technology Policy, contended, “There can’t just be a technological solution, there has to be an institutional solution.” Likewise, Patrick Vinck, Assistant Professor at Harvard University and Co-Founder and Co-Director of Data-Pop Alliance, said that innovation is happening faster than capacity building, faster than legislation, faster than community involvement. “An institutional overhaul is necessary.” And Cyrille Bellier, Head of Research and Development Unit at AFD, reminded us that “development, and especially institutional change, is a long process. We have to take this into account… when collaborating with the tech industry which operates within way shorter horizons.” What COP21 has delivered, more than just a climate action proposal, is diplomacy on its better day. Let’s see what happens next.
4. The crisis of responsibility must be fixed.
As noted in an article published on Sunday, Jeffrey Sachs, Columbia University Professor and Director of the Earth Institute, calls out those countries potentially responsible:
“At the core of the climate crisis is a challenge of collective action. Every nation emits carbon dioxide and other greenhouse gases that dangerously warm the planet. Yet decarbonization is costly, at least in the short term. Each country therefore tries to push the other countries to take on a disproportionate share of the burden.”
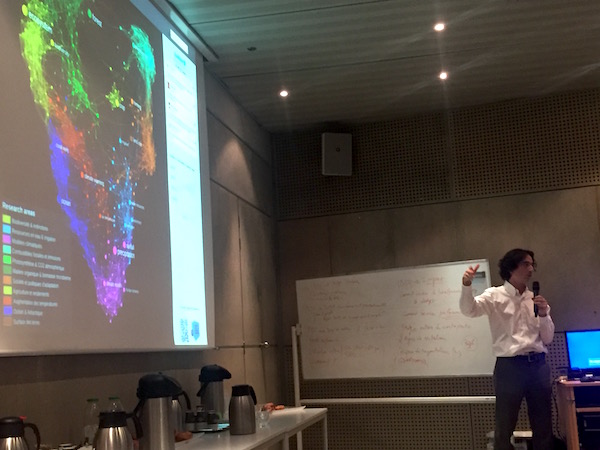
![davidchav]()
David Chavalarias, Director of Complex Systems Institute of Paris, showcases visualizations by Tweetoscope that compares data on Twitter keywords and research papers on climate change.
The question of responsibility and enforceability remains central. There are currently no legally binding global climate agreements. The other major treaties that came before, the Copenhagen Accord of 2009 and the Kyoto Protocol of 1997, along with many others but to a lesser degree of environmental (or even political) impact, were non-binding. Developed countries didn’t step up to the plate and the U.S. failed to ratify the latter vis-à-vis the Byrd-Hagel Resolution. At COP21, the EU and others are calling for a legally binding agreement, which will prove extremely challenging. At least 55 countries need to sign the agreement, representing at least 55% of all emissions, in order to ratify the treaty and make it legally binding come April 22, 2016 in New York City. However, even if a legally binding agreement prevails, and if all 175 countries uphold their submitted commitments, we will still exceed the 2°C goal. At another side event for the Equator Prize 2015 winners, the International Executive Director of Greenpeace, Kumi Naidoo, said that 2°C (3.6°F) was good for developed countries, but for developing and [and/including] island states, “We demand ‘1.5 to stay alive’.”
Who should be held responsible? Alain Retière, Co-Founder and CTO of EverImpact, asserted that cities have to be held responsible. This could be done, he believes, by providing a service to cities to help them monitor emissions by themselves. “Somebody has to be held responsible for regulating these emissions. What climate action is about in my view is having cities and territories responsible for their adaptation to climate change and for their mitigation of emission.” He continued, “At the end of the day, most of the climate problems are generated in cities. Most of the victims of climate change are more in rural areas.”
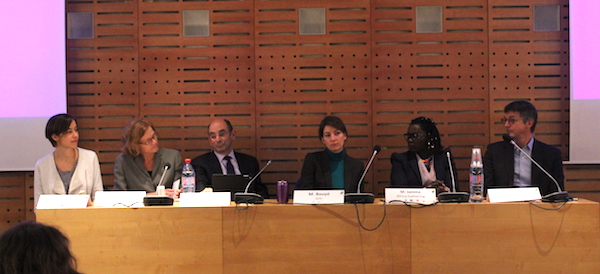
![panel 3]()
Our third panel debated issues surrounding “The economics and politics of data for resilience”. L to R: Claire-Marie Foulquier Gagnes (Policy Officer at Etalab in the French Prime Minister’s Office), Amy Luers (Assistant Director of Climate Resilience and Information at The White House of Science and Technology Policy), Mathilde Bouyé (Advisor for UN Negotiations at the World Resources Institute), Mariéme Jamme (Co-Founder of Africa Gathering and DPA Advisory Board Member), and Nicolas de Cordes (Vice President of Marketing Anticipation at Orange Group).
3. (Some) Data are a public good.
Specifically climate data, which would benefit and/or adversely affect everyone. Clean oceans, for example, are a public good, and are a quintessential tragedy of the commons case. It is crucial to open up more climate data, to make the data accessible, to share it, and to integrate it with other data sources on both national and local levels. Likewise, climate data, should be non-excludable as well.
“Resilience is a process in which you can activate or use a resource. Social cohesion is a key component here.” – Patrick Vinck
“You should have a right to know what stands in the way of your development.” – Marc Levy
“Data is critical soft infrastructure.” – Anonymous audience member
“Data as a public good – needs to be catalytic but targeted. There are real issues in funding this public good.” – Kenneth Chomitz
“I truly believe we need to open up. In France, we have opened up climate data… with datasets being open it will not only serve France and French citizens but others abroad. You have a responsibility to try and open more of that data.” – Claire-Marie Foulquier-Gazagnes, Policy Officer at Etalab of the French Prime Minister’s Office
The White House published a blog in May entitled “Two Years of Transformative Open Data for Public Good.” Chief Data Scientist DJ Patil almost had it right. Although correct about data being “a vital natural resource,” he was wrong on its framing. The hopes are that it will be “…Data as a Public Good” moving forward. We need to open up.
2. Data can empower—under certain conditions.
Sort of. Data leads to more knowledge, more ownership, and more decision-making capabilities, to name a few. But more data does not always mean less bias; it can also mean more noise. More data also raises the questions of digital privacy, security, politics, and institutional frameworks. For one, “Is the data safe to release?” de Cordes asked the other panelists. When we speak about opening up more data, especially with regards to climate data, we need to ask the questions: What can be done with the data? Who will be empowered with this data and how will this data be used for or against (or otherwise) others? What are the projected outcomes, positive, negative, and otherwise, of accessing this data? How are power struggles emerging – across public and private sectors, economic classes, political institutions, and geographies – in this new information age, the age of data? Data is powerful – let’s not forget this – and it should be recorded, stored, released, and used as such.
When speaking about “democratizing data,” understanding data, and having agency to engage in social processes because of the data, “data literacy will be most important skill of the 21st century.” – Emmanuel Letouzé
“Being able to relate to data is being able to relate to power and ask the important questions,” says Johannes Jütting of PARIS21. A video we launched in October entitled “Entering the Age of Data: A Focus on Data Inclusion” addresses more of these politically-charged questions.
“…kinds of platforms have enormous opportunities in terms of mobilizing… democratizing information. Maps have been associated with powers and can be bought.” It’s an issue over the “availability verse blockage of information.” – Silke Roth, Associate Professor of Sociology at the University of Southampton
However, the power debate is not always as we would predict. “I think in general, the information… of science communications around politically-charged issues is certainly flawed.” Amy Luers asserts that “there is a role for data analytics terms of helping to advance action on climate,” however she notes that she does not believe it will work for the “persuasion of beliefs on climate change.” One area for the role of data could be “microtargeting for marketing… buying other forms of energy for other reasons. Then the aggregate effect could be significant.”
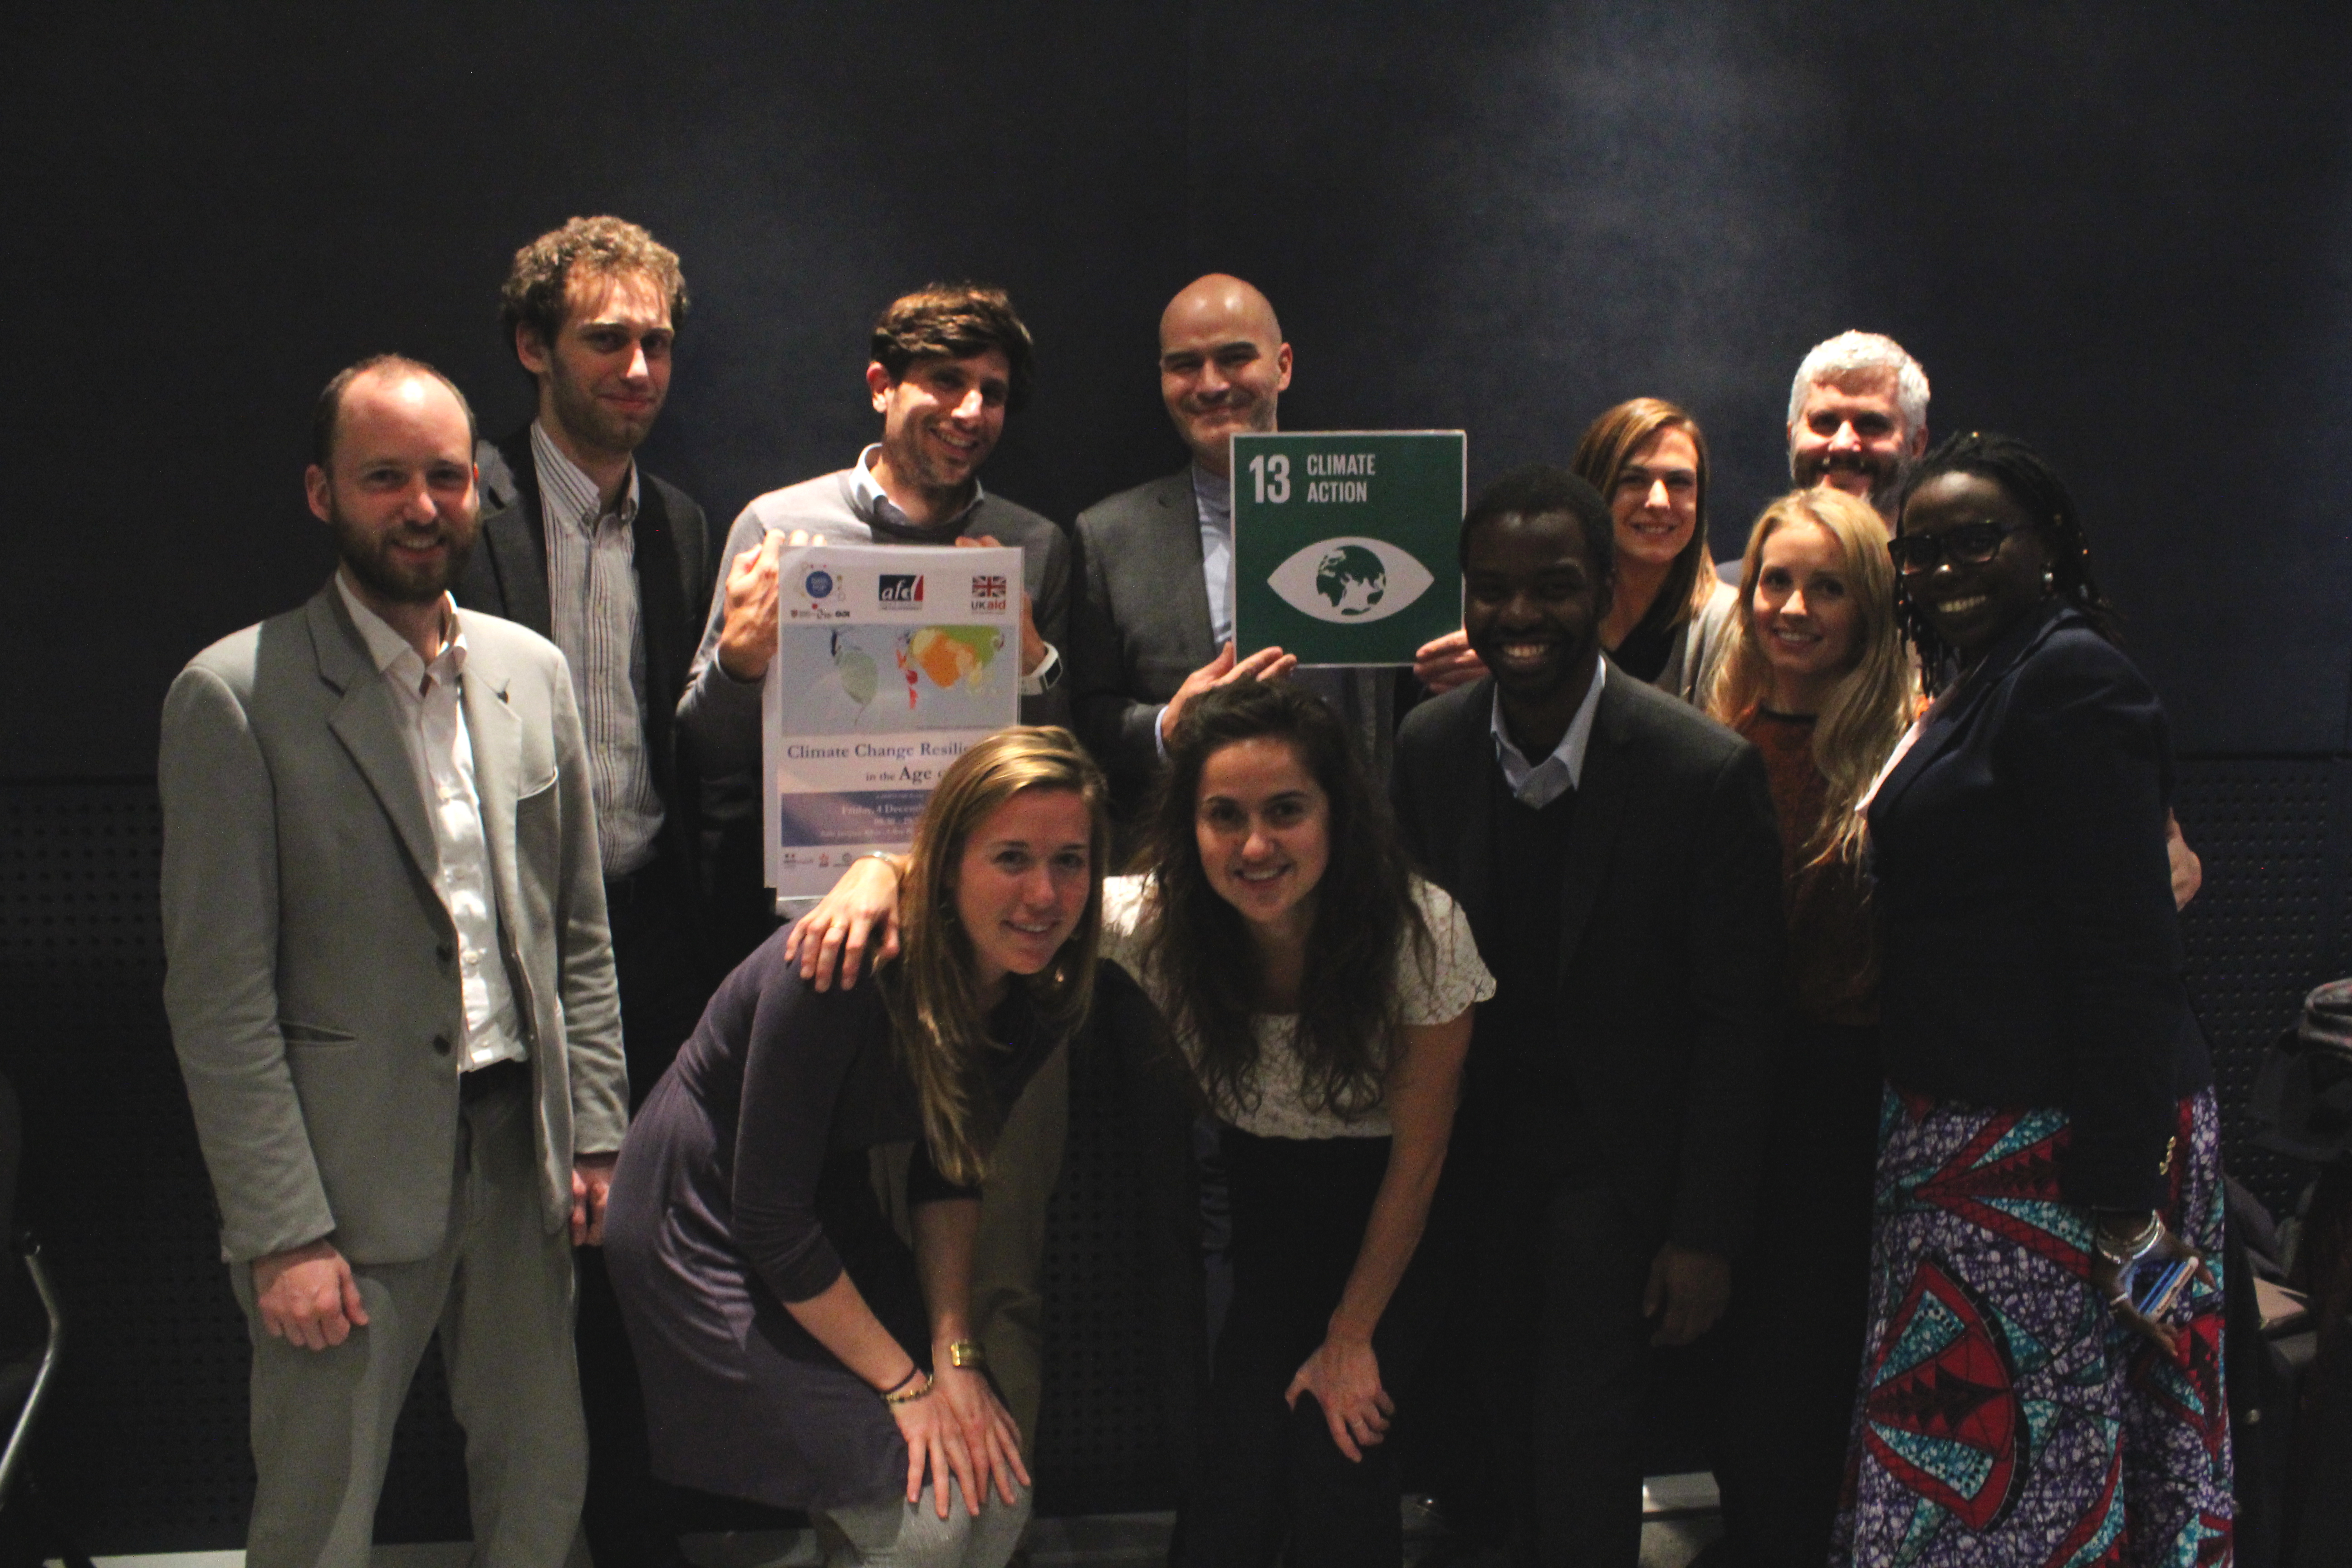
![elequipo]()
L to R: Simone Sala, Gabriel Pestre, Thomas Roca, Beth Tellman, Bessie Schwarz, Emmanuel Letouzé, David Sangokoya, Natalie Shoup, Lauren Barrett, Patrick Vinck, and Mariéme Jamme.
1. It’s a matter of quality over quantity.
“More data is not always necessary. Better data, yes.” says Vinck. The climate change risks are real and the severity of the impact is deepening. The amount of data produced can seem overwhelming, but moving forward, it will be critical to focus on the quality of the data rather than the quantity. Moore talks about the decisions that governments and citizens will increasingly have to make, even ones as great as where cities are being built. “Those decisions are being made often on very poor data,” she says. Many of those decisions rely on the history, maps, and data sets that are old, lower in resolution, and not globally consistent. We need better data to be able to make better decisions.
—
Read on for more information on the Climate Change Resilience in the Age of Data event and on our research, capacity building, and engagement work in the thematic area of Climate Change and Resilience. Search #COP21Data on Twitter for highlights. Thank you to Thomas Roca of AFD for his inputs on this post.